| : What is going on with the Universe? |
by Tina A. Harriott
Mount Saint Vincent
University
Until about four or five years ago, if asked whether known physics could successfully describe our universe, most astronomers would have said "Yes. Certainly we are confident we know what occurred after the first few seconds." There was agreement by most of the scientific community that the universe began as a "Big Bang" about 10 to 20 billion years ago and has been expanding, cooling and slowing down due to gravity ever since. The main problems left were to decide if the expansion would go for ever or not; to work out exactly how old the universe was and exactly how the universe began.
Before describing how the Big Bang scenario came about and describing the new discovery that has caused astronomers to re-think exactly how well they understand what is going on in our universe, we must first consider what the universe looks like. We also need to introduce a few of the terms used in astronomy.
One of aspect of astronomy relates to the huge distances and sizes involved. These are far beyond what we experience in our everyday lives. Astronomers use special units to measure these distances:
To help appreciate these units, consider the following:
One of the most important things to understand when viewing the universe is
that the further an observed object is from us, the further back in time we
are viewing. It takes light a certain amount of time to cross space from where
it was emitted to where it reaches our eyes; and the further away an object
is, the longer it takes the light emitted to reach us. Distances measured in
light years tell us, quite directly, how far back in time we are actually seeing.
For example, whenever we see the sun, we are actually seeing it as it was 8
minutes ago when light left the surface; a star that is 5 light years away,
we are seeing as it was 5 years ago.
Take a look at the universe around us, moving out from where we live.
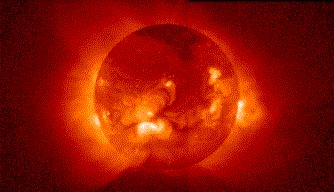
Below is an X-ray picture of our Sun -- the only star close enough to show us a visible disk -- but it is just an 'ordinary' middle sized, middle aged star.
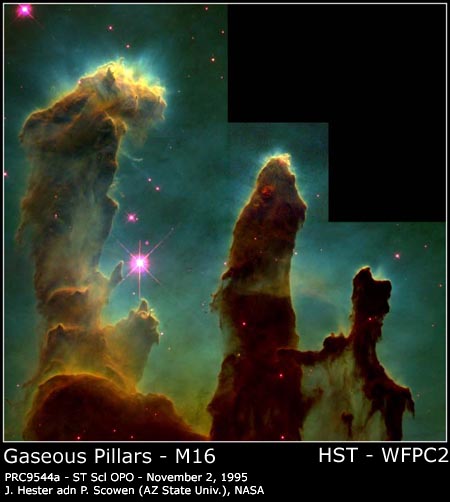
Next is the so-called Eagle Nebula, (M16)(*), as seen in the constellation Serpens with the Hubble Space Telescope. It is a huge gas cloud 2,500 ly away, and so this is actually how it looked 2,500 years ago. It is believed to be here and in other similar nebulae that new stars are made.
(*) Many stars, gas clouds and galaxies are listed in one of two famous catalogues that have designations of a letter(s) followed by a number. The letters are M, which refers to "Messier," or NGC, which refers to "New General Catalogue."
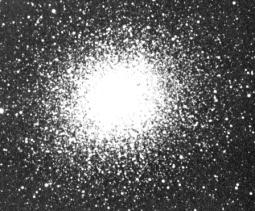
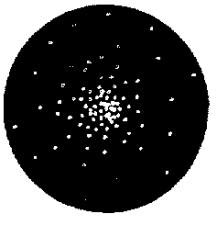
The grouping of stars shown below is called a "globular cluster," seen in the constellation of Hercules (M13). It is about 150 ly across and contains about 100,000 stars. It is 22,200 ly distant from us.
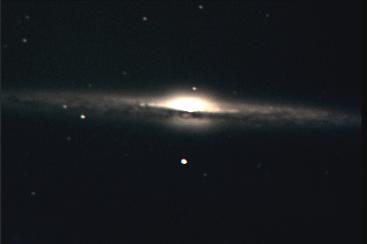
Our sun and all of the stars we can see with our naked eye belong to the Milky Way galaxy -- a huge collection of stars and gas clouds that would appear from the outside like this so-called Spiral galaxy, NGC 4565, below. This galaxy is 31 million ly away, seen in the constellation of Coma Berenices. It contains about a hundred thousand million (1011) stars. The typical diameter of a spiral galaxy, like this and our Milky Way galaxy, is 25,000 pc.
Our galaxy is only one of the countless galaxies that make up our universe.
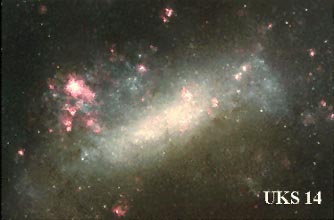
Below is an "irregular galaxy," called the Large Magellanic Cloud. It can only be seen from the southern hemisphere, and is the closest galaxy to our Milky Way galaxy. It is 180 000 ly distant from us. Although it is the closest galaxy to us, light left this galaxy before the time (0.1 million years ago) when modern man appeared on Earth!
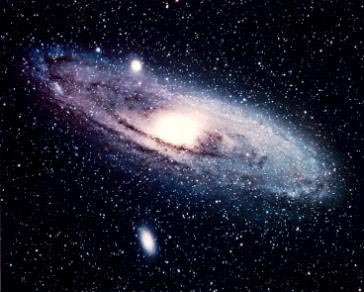
The galaxies themselves are found in groups called clusters. Our galaxy is a member of a cluster called the Local Group. The largest galaxy in our Local Group, with twice the star mass of our galaxy and the only galaxy visible to the naked eye in the northern hemisphere, is the galaxy shown below. It is called the Andromeda spiral galaxy (M31). It has a diameter of 45,000 pc and contains about 3 x 10¹¹ stars. It is 2.15 million ly away, and so we are seeing Andromeda before Homo Sapiens, who appeared 0.4 million years ago, existed on Earth.
Seen from outside, a galaxy cluster looks like this:
Above is a galactic cluster in Draco, which is 2 billion ly distant. We see it as it was long before the dinosaurs roamed the Earth, 200 million years ago. A cluster may contain thousands of galaxies. The Virgo cluster, for example, contains at least 2,500 galaxies.
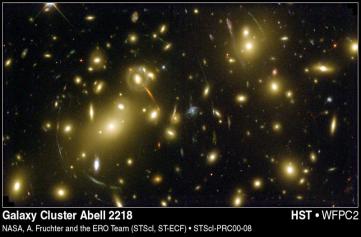
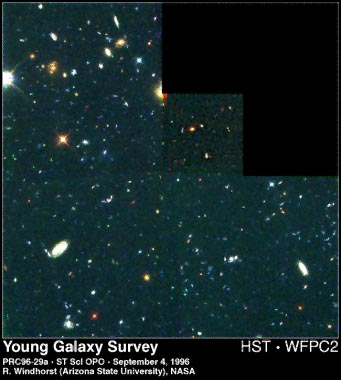
Below is the galaxy cluster in Hercules, 11 billion ly away, as seen by the Hubble Space Telescope. To get a feeling for the scale of this picture, imagine holding a dime at arm's length and look at "eye of the queen". The picture below covers the same amount of the sky as that hidden behind the "eye of the queen," and it contains 20,000 galaxies. Imagine how many "eyes of the queen" it takes to cover the sky! And this is only those galaxies we can see. There are more we cannot yet see due to telescope limitations.
It was Newton who made the first serious attempt at explaining the universe around him. He did this by introducing his Universal Law of Gravitation (1687) in which he states that "...every body attracts every other body with a force proportional to the size of their masses and inversely proportional to their separation..."
| F = | Gm1m2 |
| r2 |
Newton was the first to suggest that the same force that keeps our feet on the surface of the earth was also responsible for keeping the Moon in its orbit around the Earth. The law was also used to successfully explain the ocean tides and the orbits of most planets -- except Mercury.
The orbit of Mercury and all other planets about the sun are elliptical. These ellipses do not quite close on themselves due to the influence of the other planets in the solar system. Mercury's orbit looks as shown below
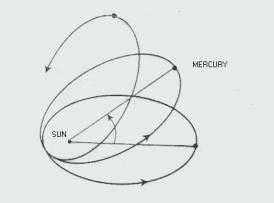 |
For Mercury, Newton's Law could never quite explain the large amount by which Mercury's orbit changed over time. (This is called the anomalous perihelion advance of Mercury). At one time, the existence of a planet called Vulcan, orbiting very close to the sun inside of Mercury, was suggested to try and explain Mercury's orbit -- but Vulcan was never found. It was this "Mercury problem" and other limitations of Newton's Law that led Einstein and others to suggest another way of describing gravity.
Einstein proposed his theory of General Relativity (1915) and the main points of his theory are
The mathematical equations of General Relativity that describe the above things are
| Gab = | Rab -- ½ gab R | = 8πG/c2 Tab |
| "Curvature terms" | "Matter terms" |
gab is the metric tensor and measures the infinitesimal space-time distance between any two neighboring points.
Rab and R are called the Ricci curvature tensor and the Ricci curvature scalar. They measure how much the space-time is curved.
Tab is called the stress-energy (matter) tensor.
These equations have infinitely many solutions. They were immediately successful at explaining the orbit of Mercury and a number of other previously unexplained observations.
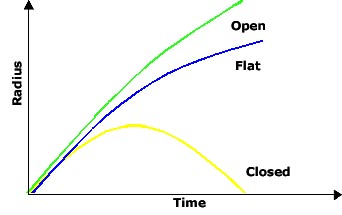
When applied to the universe as a whole, under a few reasonable assumptions, these equations predicted three possible scenarios for the universe:
These three possibilities are often depicted graphically as
shown below
 |
These scenarios may seem reasonable to us today, but Einstein was initially horrified because the view at that time was that the universe was static and unchanging. None of the possibilities suggested by his equations were static! He immediately set out to modify his equations by adding an extra term:
| Gab = | Rab - 1/2 gab R - Λgab | = 8πG/c2 Tab |
| Curvature | Cosmological Constant | Matter |
A static solution is then possible because the extra term Λ acts like an "antigravity" force.
Shortly after Einstein finished the modifications to his equations, Edwin Hubble made a major discovery (1929). Hubble measured distances to several galaxies using some special stars called Cepheid variable stars. He also measured the velocities of those galaxies using the Doppler Effect. He found that all galaxies were receding from us with a speed that increased with distance -- just as if the universe had begun some time in the past from an explosion ... the so called Big Bang.
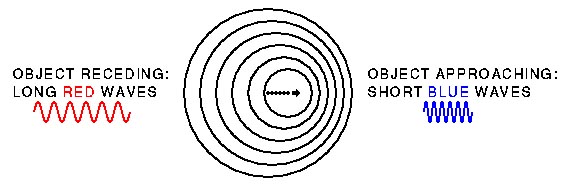
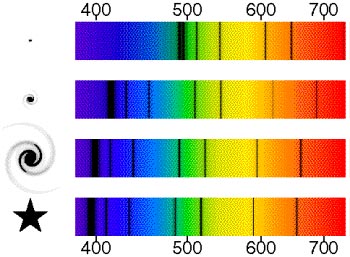
To explain how he found the velocities of the galaxies, we need to understand the Doppler Effect for light. If light is imagined to be a wave, then different wavelengths represent different colors. The shorter the wavelength, the more blue the color. As shown below, if a light wave approaches an observer, then all the waves pile up on one side -- they look bluer. If a light wave recedes from an observer, then there is a longer gap between the waves-- they look redder.
Light from stars and galaxies is usually observed spread out into a spectrum. These are not just the familiar rainbow spectra; they are called absorption spectra because they are crossed by a number of dark lines as shown below. These lines act like cosmic fingerprints, because every known chemical element has a unique set of such lines. Seeing what lines are present in any spectrum tells astronomers what elements are present in the star or galaxy. These lines have unique positions in the spectrum, but if the source -- in this case a star or galaxy -- is moving away from the observer, then this unique position is shifted to the red end of the spectrum. In this diagram, as the galaxies move away faster, the dark lines are shifted more and more to the right (the red end). In this way, by observing the Doppler shift of the spectral lines, Hubble could tell how fast the galaxy was moving.
Hubble also had to know how far away the galaxy he was looking at was in order to come up with his result that says: "The further away the galaxy is, the faster it is receding from us." Distances to stars and galaxies are one of the hardest things to measure in astronomy. It can be done directly only for a few thousand of the closest stars -- those whose distance is less than a few thousand light years. Beyond this distance, measurements of distances are done indirectly by using so called "standard candles," which are Cepheid variable stars and Type Ia supernovae.
To find the distance to any astronomical object, we need to know:
Then use the formula:
M = m + 5 - 5 log d
to find the distance d.
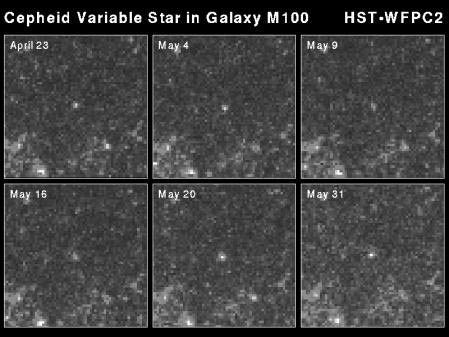
In general, the actual brightness of a star is very difficult to measure. However, it can be done for Cepheid variable stars. These are old unstable giant stars that are pulsating rhythmically and obey a Period- Luminosity Relation discovered by Henrietta Leavitt in 1912. Their period of oscillation is found by observing them over an interval of time and watching them fade and brighten in a regular fashion, as shown in this sequence of pictures below.
This period can be related to their true brightness using the following graph.
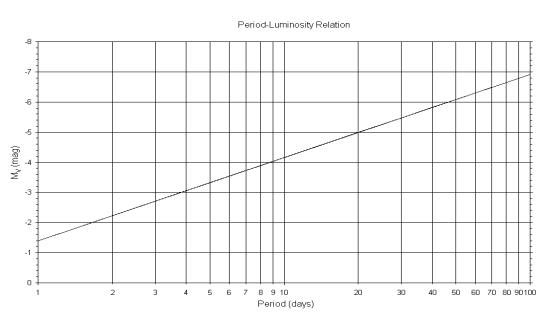
Using this technique, one can find the distance to any galaxy in which Cepheid variable stars can be identified. The most distant galaxy observed to have Cepheids is NGC 4603, a Spiral in Centaurus that is 108 million ly away.
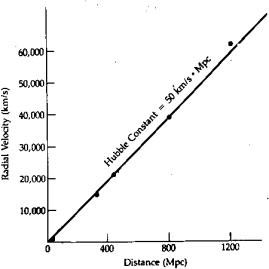
The velocity versus distance relationship for galaxies found by Hubble is now called Hubble's Law: v = Hod
 |
Ho ,which is the slope of the graph, is an estimate of the age
of the universe (because speed = distance / time.)
With the expansion of the universe established by Hubble's observations, Einstein abandoned the Cosmological Constant modification to his equations of general relativity. He called it the "biggest blunder of my life." (But with the latest results about the universe this may not be the case. The Cosmological Constant may be needed once again!)
Work began to determine which of the three types of universe we live in. There are three main possibilities and which one actually describes our universe depends on the amount of mass that is in the universe. The three choices can be described as follows:
| AMOUNT OF MASS |
CURVATURE |
RESULT |
|
| Critical mass |
Flat |
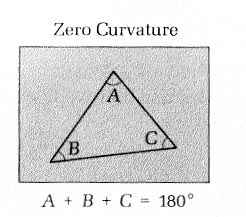
Zero |
Expansion slows to zero as time tends to infinity |
|
Less than critical mass |
Open |
Negative |
Expansion at a decreasing rate forever |
| More than critical mass |
Closed |
Positive |
Expansion stops, universe re-collapses |
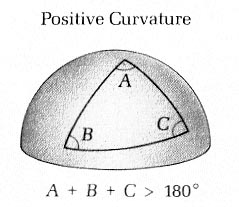
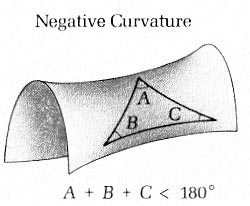
To understand what is meant by positive and negative curvature, consider the following pictures of what a triangle would look like in the three different universes:
 |
 |
 |
|||
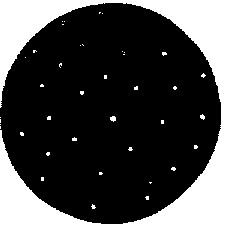
As far as observing the universe is concerned, these three possible curvatures would, in principle, give us the following three different views of distant galaxies:
FLAT |
CLOSED |
OPEN |
|||
 |
 |
 |
In practice the differences are difficult to determine.
Up until about five years ago, the following was what astronomers believed from their observations and calculations:
Although these points above are not in complete agreement with each other, it was believed that further refinement of observations would clear up any discrepancies.
In November 1998, a number of new observations of Type Ia Supernovae caused a stir in the astronomical world.
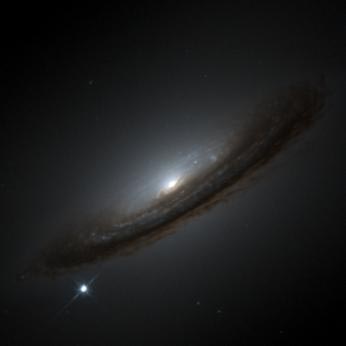
Type Ia supernovae are used as standard candles for distant objects -- galaxies too far away to be able to identify any Cepheid variable stars. This picture below shows what a supernova looks like. A supernova is a star that literally blows itself to bits in a gigantic explosion. In this picture the supernova, at the bottom left, is as bright in the photograph as the whole galaxy. This means that such supernovae can be seen in galaxies much further away from us than the galaxies in which we can identify Cepheid variable stars.
SNR 1994 D
Such a supernova arises in a binary star system (i.e. a pair of stars orbiting each other) in which one star is a White Dwarf, which is an old star that has a radius of about the same as the Earth, (for comparison, the Sun has a radius about 100 times that of Earth), and in which the other star in the binary system is a Red Giant, which is a large star that has a radius of about 100 times that of the Sun. If these stars are sufficiently close together, material streams from the Red Giant onto the White dwarf.
The physics of such a process is well understood. The white dwarf's mass increases because of the material streaming onto it. When the mass reaches a certain specific value, there will be a catastrophic explosion completely destroying the star.
It is known that ALL Type Ia Supernovae have the SAME actual brightness, and so measuring their apparent brightness tells how far away they are. In this way, they are excellent distance indicators for these far away galaxies.
Below is a sequence of photographs taken of such a Type Ia supernova explosion in 1997.
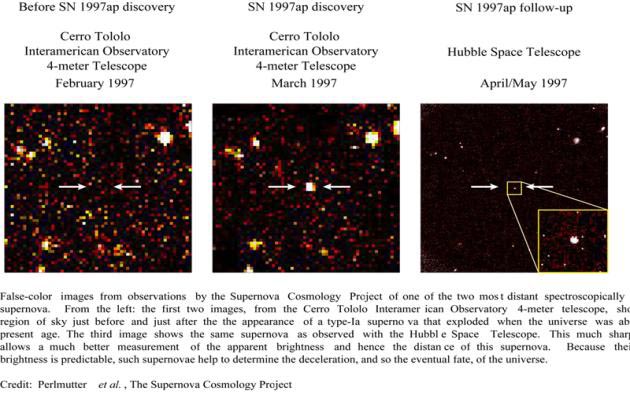
It was these observations and others that first indicated something unexpected was going on in the far distant parts of our universe.
The observations suggested that the most distant Type Ia Supernovae are receding more slowly than expected from Hubble's Law.
Another way of stating the result is that the most distant Supernovas are 25% dimmer than expected.
Their distance, as suggested by their brightness, places them further to the right on Hubble's graph than their velocity places them.
 |
This observation suggests an accelerating cosmic expansion. Instead of gradually slowing down, as all standard Big Bang models predicted, the universe was actually speeding up! It suggested that the Universe must be dominated by an "antigravity force" at the largest scales, like the "antigravity" force that Einstein had put in his equations when he modified them to try and make a static universe.
At first astronomers were doubtful, thinking that the observations were wrong, that maybe there were other reasons why these supernovae were dimmer than expected -- such as dust in the space between the supernova and Earth.
The observations were repeated and the dust idea was ruled out. Many other supernovae were observed. Every observation gave the same indication, and now it is becoming accepted by a large number of astronomers that indeed the cosmic expansion is accelerating.
Now generally accepted as a valid observation, interest is turning to ask if this acceleration might help explain some things observed in our universe that were problematic to the old Big Bang models. For example, it would explain why the universe appears flat, with about 70% of the contribution to the needed energy density coming from the L term and only a small portion coming from the visible matter.
It also increases the calculated age of the universe, because galaxies would take longer to reach their current separation as they were moving apart more slowly in the past than they are today. This means that some of the globular clusters are no longer calculated to be at least as old as the universe. That was a very uncomfortable situation in the standard models!
Of course, there is still at least one unanswered question: Exactly what is this Λ term?
Acknowledgements:
Unless otherwise credited, photographs in this article are from the Astronomy Picture of the Day website which is maintained by NASA. (http://antwrp.gsfc.nasa.gov/apod/ )
Diagrams in the article were constructed by a research student at Mount Saint Vincent University, Tammy Schaller.